Full control with Siteinfo
Automatic tank gauging system and smart tank level monitoring gives you total control and can save both time and money. You read the levels of your tanks from your computer or mobile phone. With full control over the levels, you eliminate empty tanks, expensive emergency deliveries and potential penalty fees. In addition, you can optimize the efficiency of tank level and transport planning as well as minimize the health and injury risk for your staff. Last but not least, you contribute to a better environment and a sustainable future as your transports become shorter, which reduces your transport costs and thus your CO2 emissions.

Integrate your system to Siteinfo
Over the years, we have helped most customers with their own local systems to connect to SiteInfo. Via our newly developed web APIs and through import and export of data, we can help you get a full overview of your facility.
By reusing existing systems, packaging and presenting data uniformly in SiteInfo, you have full access to all your measured values in one place. We can also offer customized import and export of data. Contact us if you want to know more.
What functions come with Siteinfo?

Readouts
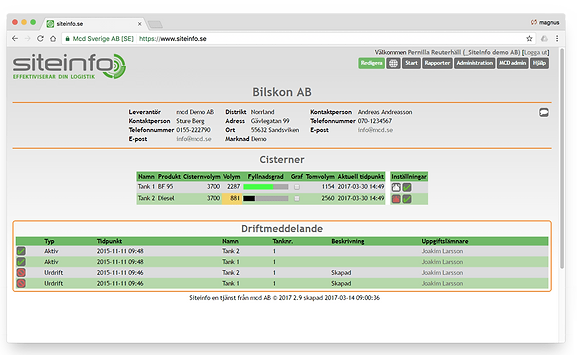
When loging in to SiteInfo, all the sites that are connected to the service are shown. You gain a quick overview of all your sites and relevant information. You are able to customize this overview page to show and sort the site according to your own needs, e.g by name of site, city or by product.
When the number of connected sites begin to grow you can quickly find the information you need by combining your choice of columns and filters.
If you need an email notification when the level reaches the set alarm level you are able to configure this for each tank. Tank level history is saved hour by hour and is presented in both a table and a graph.
Level measurement wherever you are
With SiteInfoApp you can monitor the tank levels wherever you are. It is created for the end user and ties together the functions of SiteInfo. The use of the SiteInfoApp is free to any user of SiteInfo. It is a service we provide to give the user a smarter working day.
Like the browser version of SiteInfo, it is possible to customize the app specifically for your company with your own logo and the settings you find relevant. Please contact us for more information regarding the possibilities.


Graph and forecast
In the graph you will gain a historic overview of the consumption in the tank over the time period of your choosing. The historic level data is saved for up to three years.
In the graph you can see the alarm and warning levels configured for the tank. You can also see the safety volume and dead volume configured for the tank.
Collected level data gives you detailed statistics about each site. You are able to see the average daily consumption, the deliveries to the tank during the chosen time period and more. Based on the archived level data in the graph you are able to obtain a consumption forecast for the tank.
Reports
By using SiteInfo you will have access to standardized reports for things as stock and volume history. The reports are shown in SiteInfo but can be exported to Excel.
By utilizing a specific set of columns and filters, you are able to create your own reports that you are then able to export to Excel.


SiteInfo gives you a full overview
As a user with administrator rights, you have access to additional administrative functions. You are able to see the users who have access to your site, their user rights and you will be able to create new user accounts. You will also be able to edit users, contacts and products.
With SiteInfo and its map functionality you are able to gain an overview of your choice of tanks with alarm and warning levels. If an alarm is triggered, you will be able to see the tank in question displayed on the map.
Subscription
The subscription is based on the measurement data transmission intervals. Measurement data import through system APIs are offered depending on solution.
Minutes
Data transmission interval several times per hour (SiteMonitor).
Hours
Data transmission interval several times a day (battery powered equipment).
Days
Data transmission interval is daily or more seldom (battery powered equipment).
Manual
Manual input and transmission of data independant of interval (SiteBasic).

1. Analysis
We will meet and review your needs and work with your team to offer the best fit product or service
How it works

2. Installation/Integration
Depending on your needs and conditions, we, together with our project management or development department, agree on an action plan for installation or integration

3. Commissioning
We will train you and make sure you get started with SiteInfo right away. If you need help, our knowledgeable support and developers are never more than a phone call away.
